
Data collection
APIs, FOIA, FOIL, Beautiful Soup, Selenium, surveys, Github Action Pipelines.
APIs, FOIA, FOIL, Beautiful Soup, Selenium, surveys, Github Action Pipelines.

Python, Pandas, R, SQL, Q Research Software, Excel, Google Sheets.

R Studio, Illustrator, DataWrapper, ggplot, Tableau, QGIS, ai2html, GeoJSON, Mapbox.
The South Asian Council for Social Services food pantry balances a rise in need and the looming fear of COVID-19.
Columbia News Service
February 17, 2022
Excel DataWrapper
Read more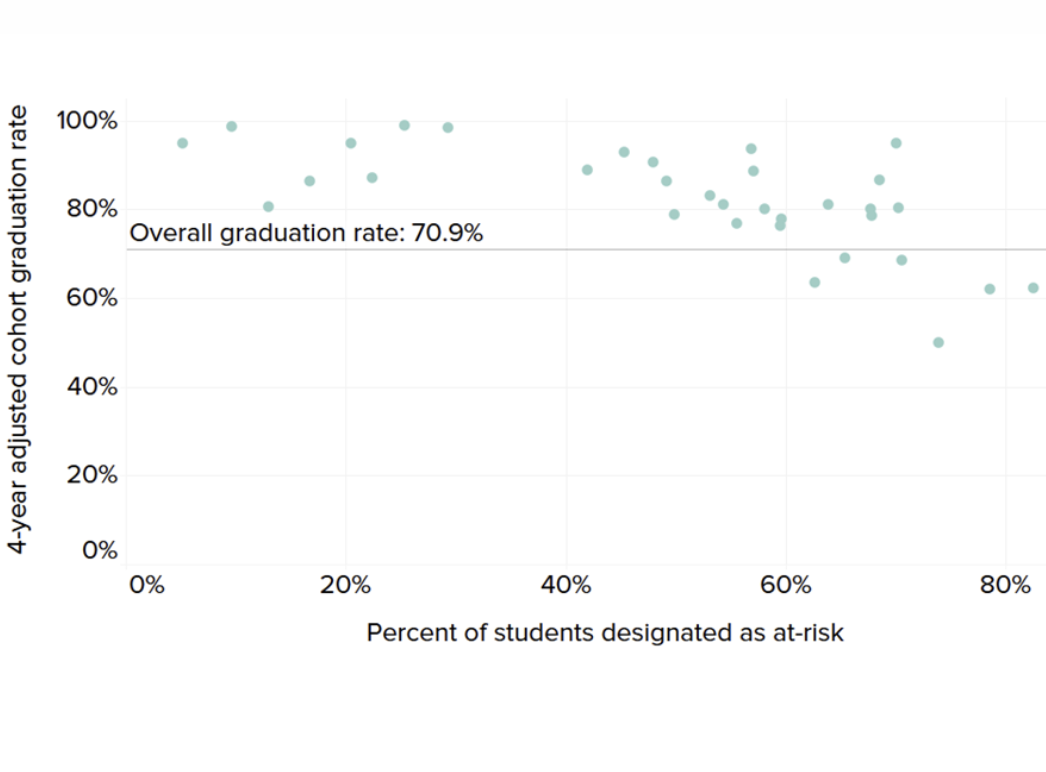
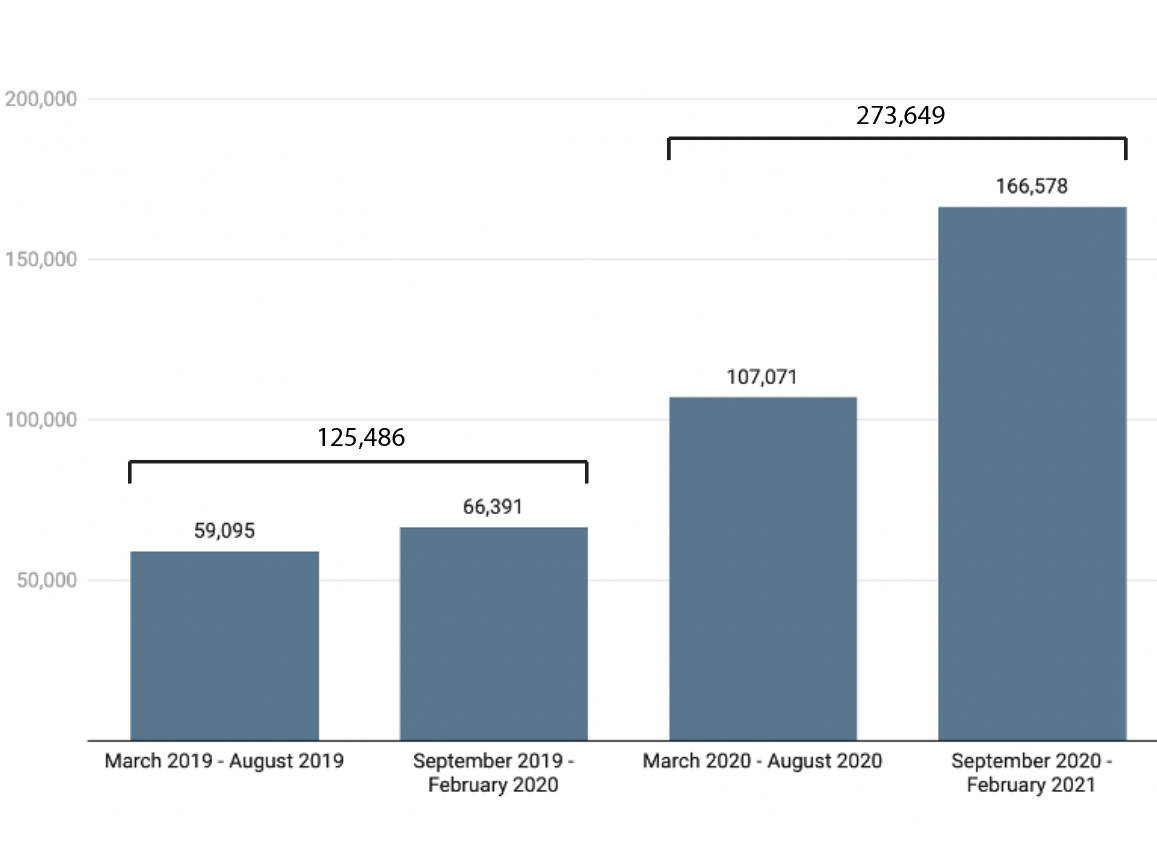
This briefing takes stock of how the pandemic may have affected high school students and highlights its impact on students designated as at-risk.
D.C. Policy Center
May 12, 2021
Excel Tableau
Read more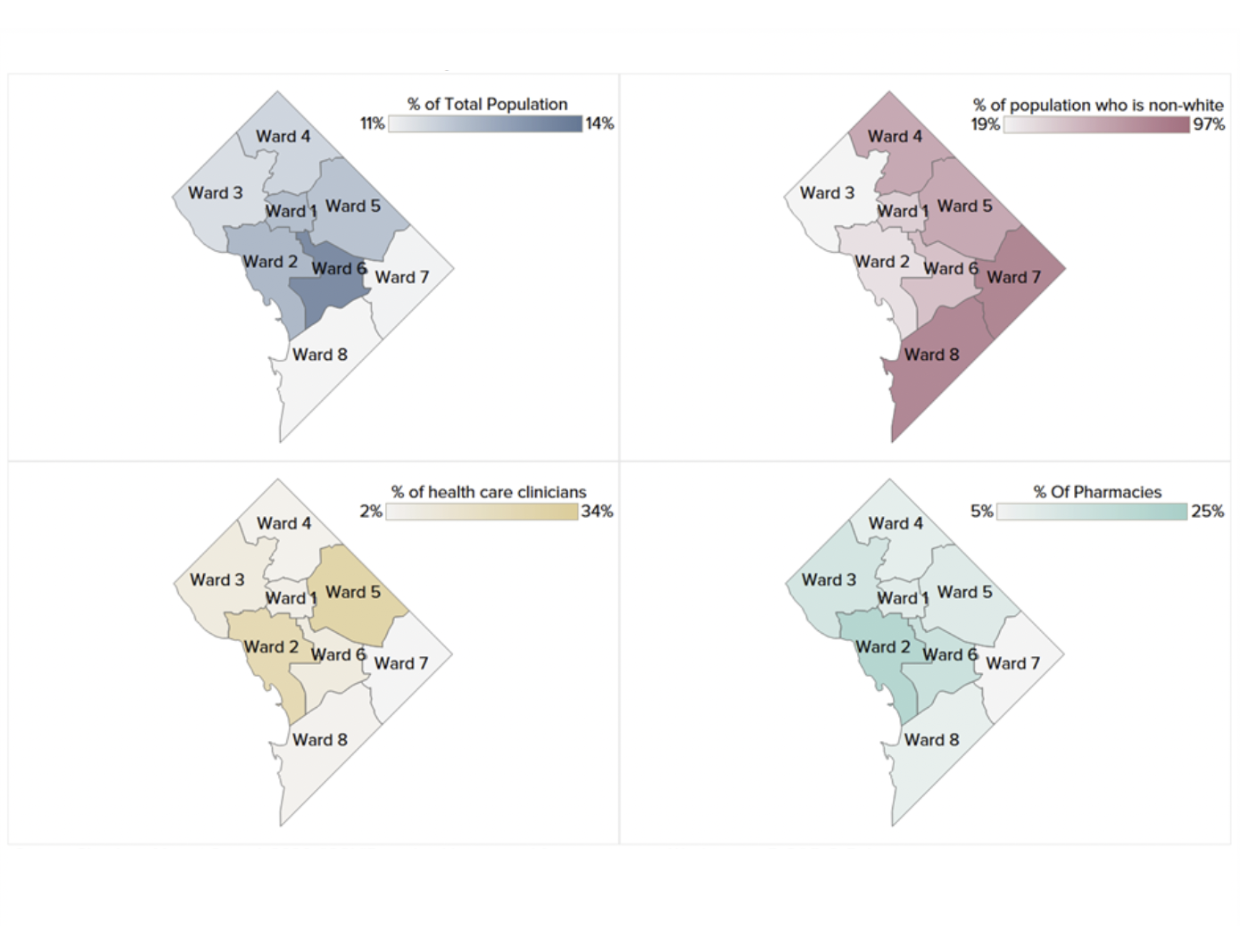
Given pre-existing disparities, the pandemic’s impact has been even greater for students of color and students from low-income families.
D.C. Policy Center
March 9, 2021
Excel Tableau
Read more
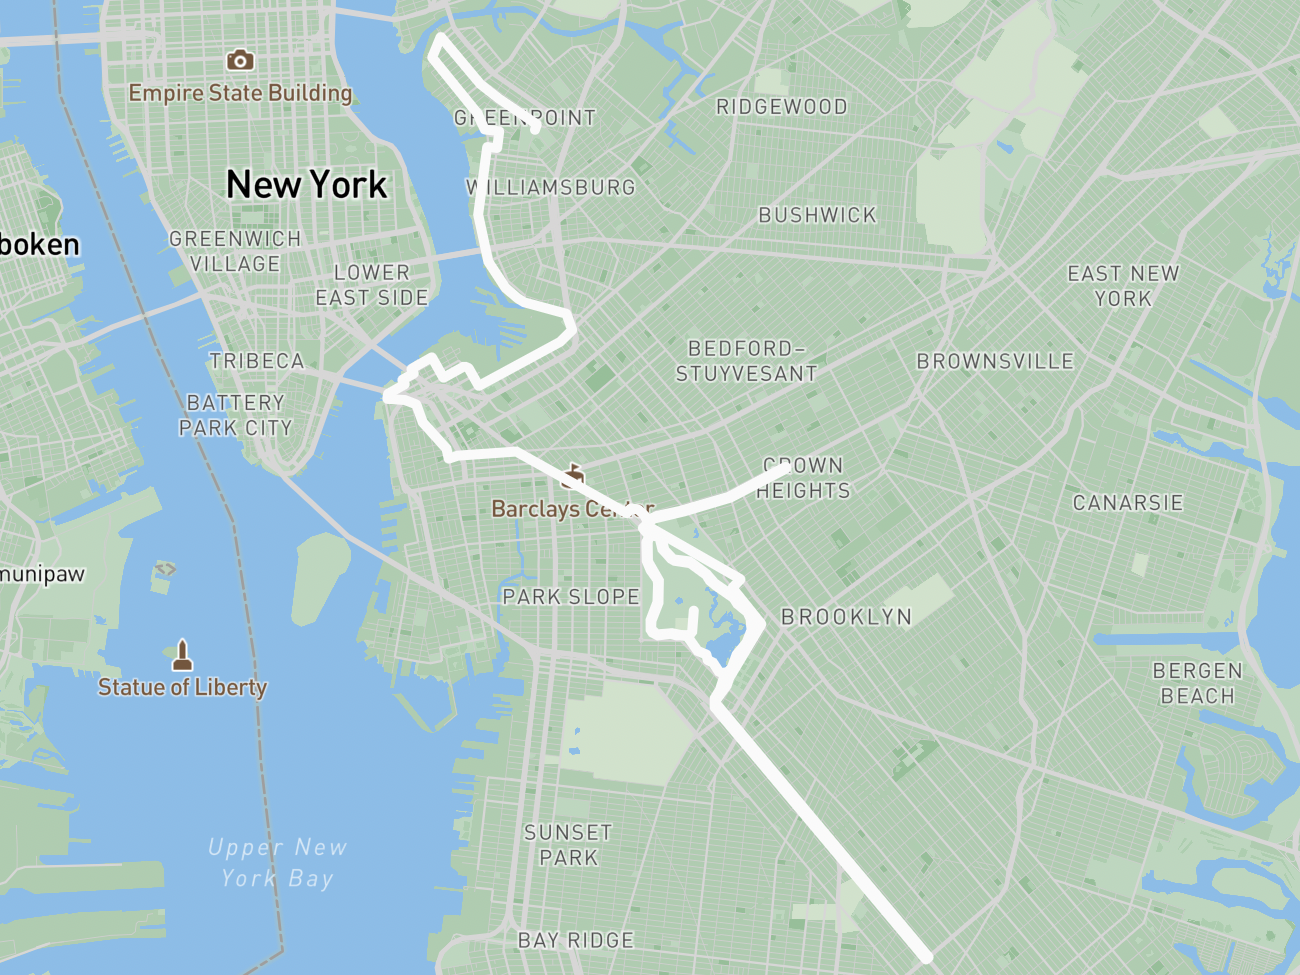
On June 15th, 2021, city officials approved an initiative launching New York City's second official marathon. On April 24th, 2022, over 20,000 participants will run this course for the first time.
Columbia Journalism School
April 3, 2022
GeoJSON Mapbox
Read more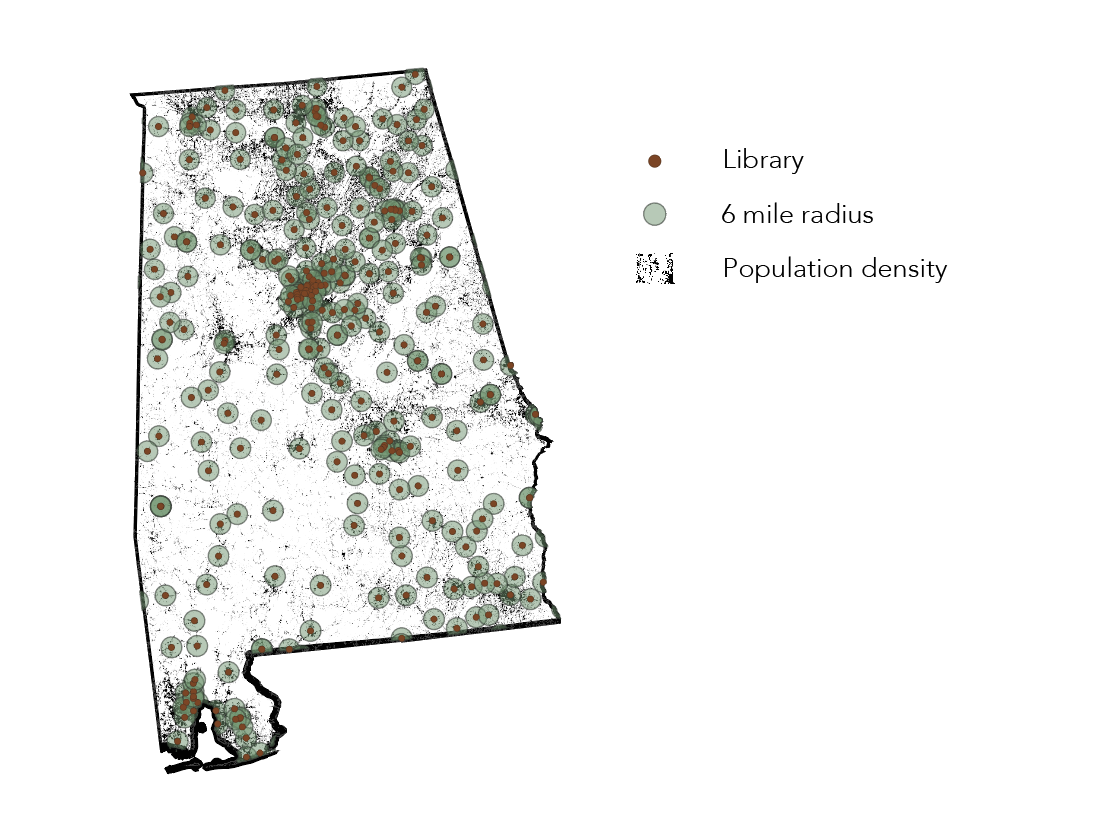
Studies show that those who live more than six miles away from a libary are far less likely to use it. This analysis will show how many people in each state live too far away from a library.
Columbia Journalism School
March 12, 2022
Beautiful Soup Python Pandas QGIS Illustrator DataWrapper ai2html
Coming soon
During the 2021 dry season, nearly 50% of the state experienced exceptional drought - the most intense level of drought. 2022's dry season is poised to be even more severe.
Columbia Journalism School
April 22, 2022
Python Pandas Illustrator ai2html
Read more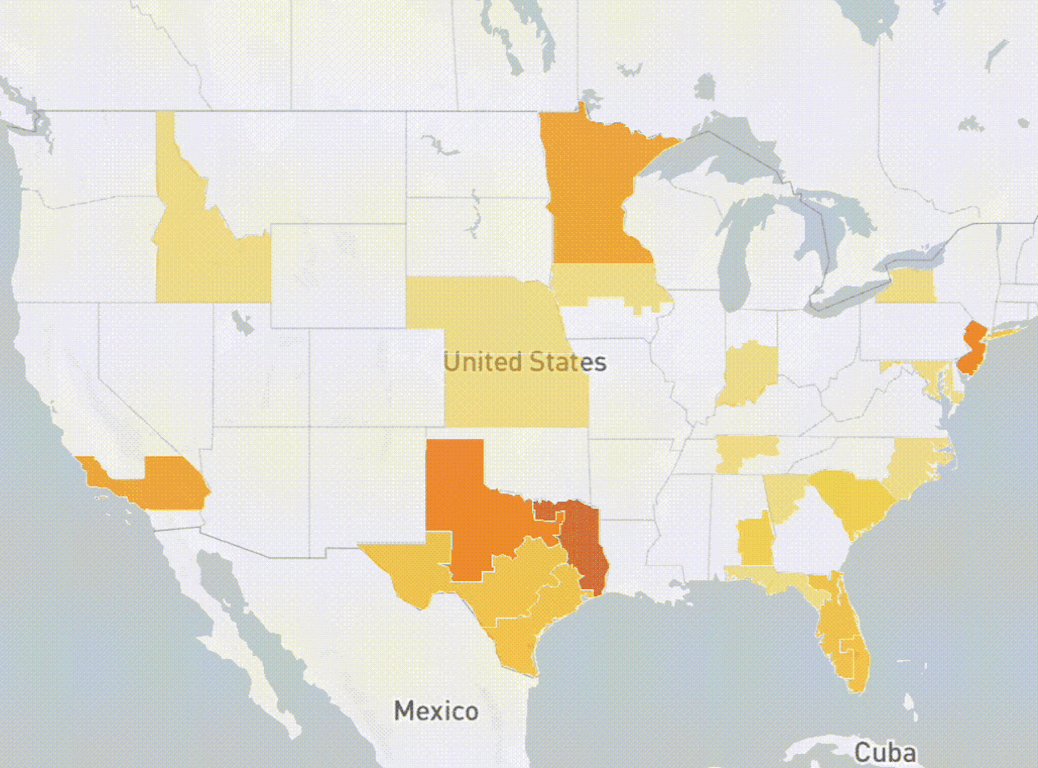
During Trump’s term, the number of emergencies soared in blue states and decreased in red states. The average number of days that an emergency sat vacant increased from 648 in 2016 to 923 in 2020.
Columbia Journalism School
December 16, 2021
Beautiful Soup Selenium Python Pandas GeoJSON Mapbox
View code